Perlin Noise 介绍
Perlin 噪声(Perlin Noise)是由 Ken Perlin 在 1983 年为电影《Tron》开发的一种平滑伪随机噪声算法1。它能够生成具有自然纹理的随机模式,广泛用于计算机图形学中模拟云彩、地形、火焰、木纹、水流等自然现象2。
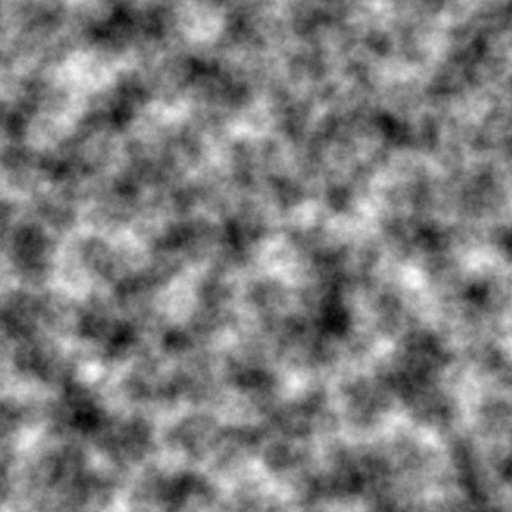
与普通白噪声不同,Perlin 噪声具有空间相关性:相邻采样点的值变化平滑,没有突兀的跳变。这种平滑特性使得它生成的纹理更像自然界的连续变化。
我的世界就采用 Perlin Noise 来作为生成无限世界地图的基础算法。
噪声类型
1D 均匀白噪声
1D 均匀白噪声 就是一维的、服从均匀分布的白噪声信号。
import numpy as np
import matplotlib.pyplot as plt

def sample_random_points(num_points):
    # 采样器函数,返回num_points个0~1之间的随机数
    return np.random.rand(num_points)

def draw_random_strip_image_from_samples(rand_1d, width, height, filename, thickness=1):
    num_points = len(rand_1d)
    cols_per_point = width // num_points

    rand_pos = (rand_1d * (height - 1)).astype(int)
    img = np.zeros((height, width))
    for i, row in enumerate(rand_pos):
        start_row = max(row - thickness, 0)
        end_row = min(row + thickness + 1, height)
        start_col = i * cols_per_point
        end_col = start_col + cols_per_point
        img[start_row:end_row, start_col:end_col] = 1

    plt.imshow(img, cmap='gray', origin='lower')
    plt.axis('off')
    plt.show()
    plt.imsave(filename, img, cmap='gray')

if __name__ == "__main__":
    rand_noise = sample_random_points(512)
    draw_random_strip_image_from_samples(rand_noise, 1024, 512, "random_noise_1d.png")
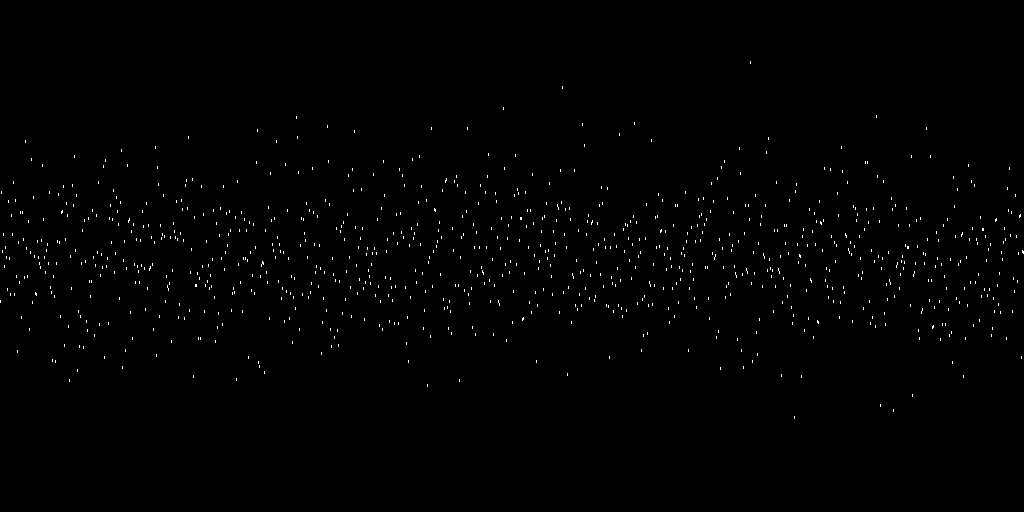
对于一维随机噪声来说,生成的随机点之间是没有任何关联的。
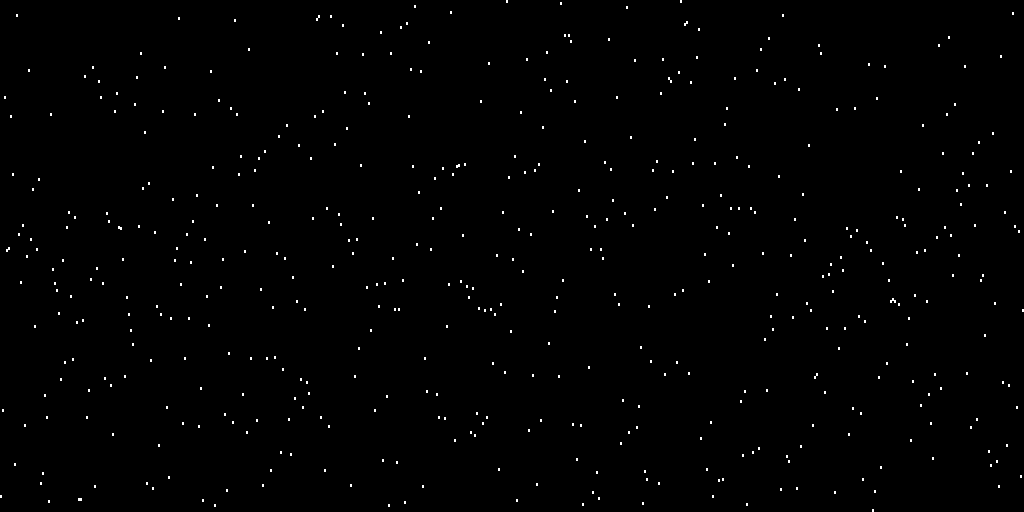
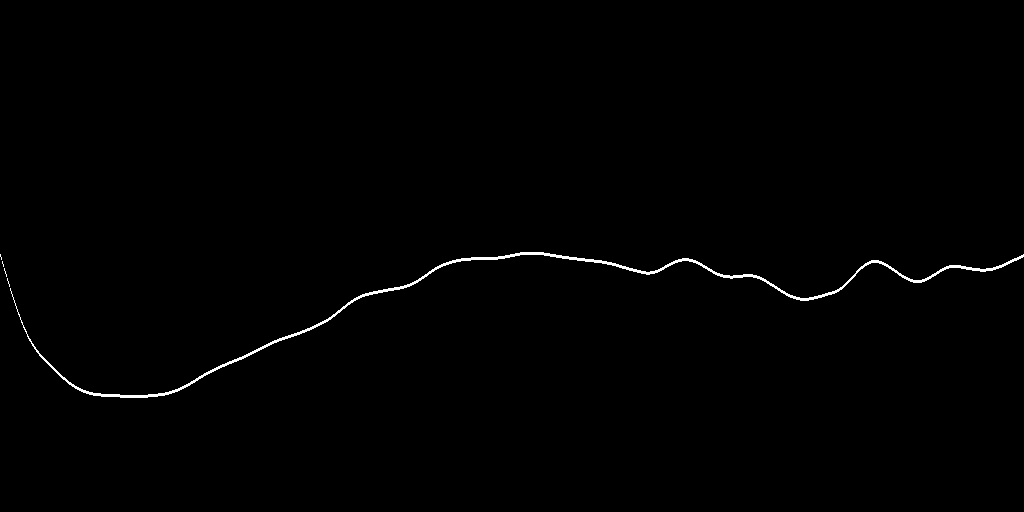
如果采用Perlin Noise,得到的是连续而光滑的曲线。
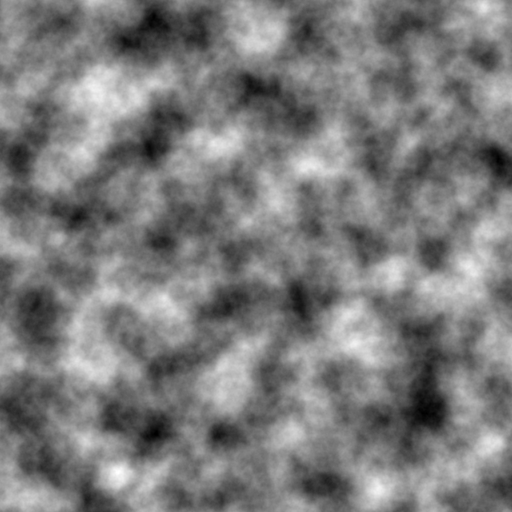
2D 均匀白噪声
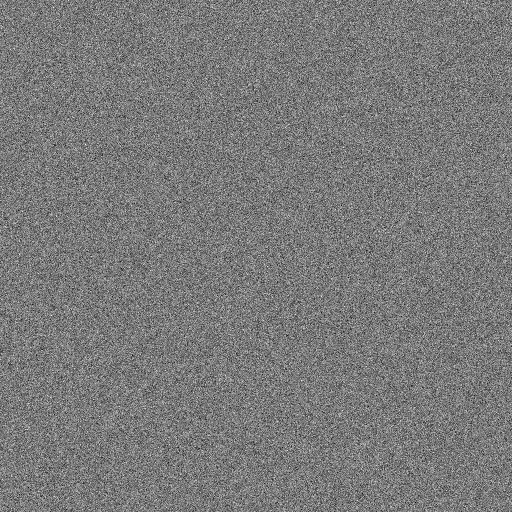
如果我们随机生成一张均匀分布的噪声图,结果就是均匀白噪声,它们每个点和相邻的点之间是没有任何联系的。
import numpy as np
import matplotlib.pyplot as plt

# 生成 512x512 的随机浮点灰度图,值范围0~1
noise = np.random.rand(512, 512)

plt.imshow(noise, cmap='gray')
plt.axis('off')
plt.imsave('random_noise.png', noise, cmap='gray')
完全随机的噪声:
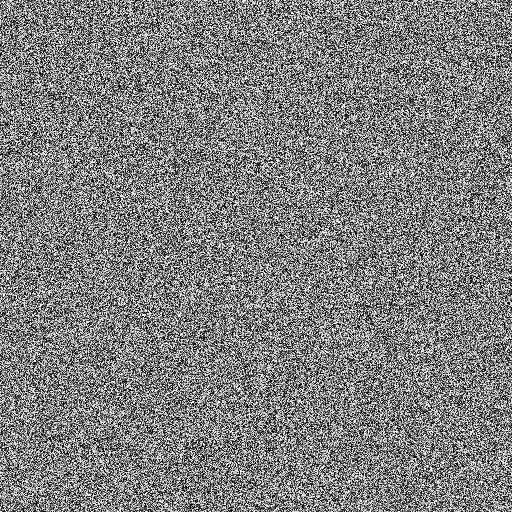
而 Perlin Noise 相邻点直接是有关联的,相邻点的数值上要求接近而且平滑。
高斯白噪声
import numpy as np
import matplotlib.pyplot as plt

# 生成512x512的高斯白噪声,均值0.5,标准差0.1
noise = np.random.normal(loc=0.5, scale=0.1, size=(512, 512))

# 将值裁剪到0~1范围内,防止显示异常
noise = np.clip(noise, 0, 1)

plt.imshow(noise, cmap='gray')
plt.axis('off')
plt.imsave('gaussian_white_noise_2d.png', noise, cmap='gray')
plt.show()
由于非均匀分布,看起来会比白噪声更加柔和一点。
高斯分布在一维上看起来会更加明显,因为有一个明显的中心带,集中了绝大多数点。
1D Perlin Noise
如果我们需要理解 Perlin Noise 中分型相关的概念,我们需要先理解一下Fade、周期性和频率倍率的概念3。
Fade
在已知一系列点的数值的情况下,如果希望求中间的点的数值,可以通过线性插值产生折线,通过 Cosine 插值产生平滑的曲线。
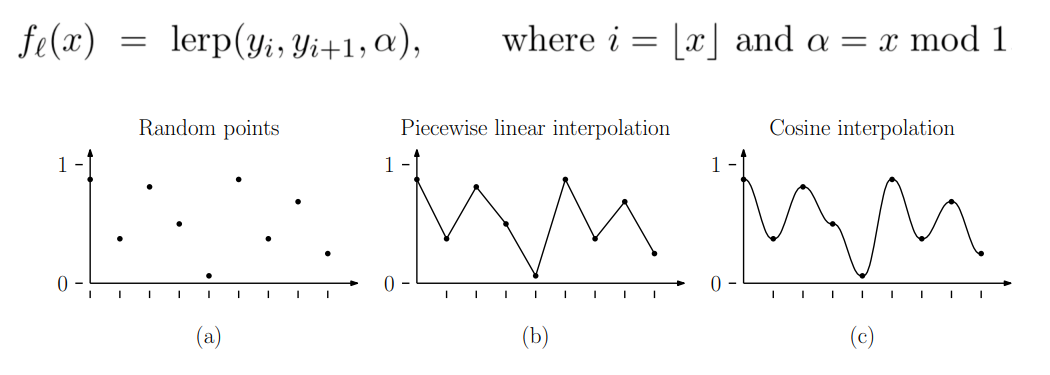
余弦插值可以用下列公式,
$$ x = x1 + (x2-x1) * (1 - cos(\pi \alpha)) / 2 $$
不同的插值方法的目的,就是在过渡处产生平滑的曲线而不是折线。除了余弦函数,还可以用三次函数、五次函数等等插值方法。
这种把线性插值,转化为平滑插值,就叫 Fade 。
Perlin 在改进型的噪声生成算法中采用的 Fade 函数是,
$$ t = 6 t^5 - 15 t^4 + 10 t^3 $$
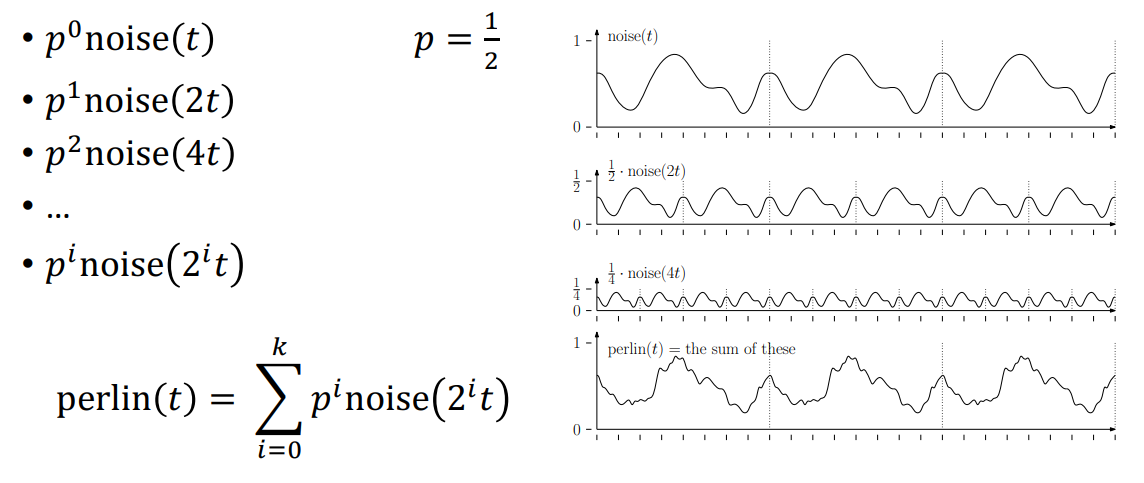
Octaves
如果将采样频率不断翻倍,就可以获得不断减半周期的函数。由于音阶每个八度之间就是频率翻倍的关系,所以这里也叫做 Octaves 。
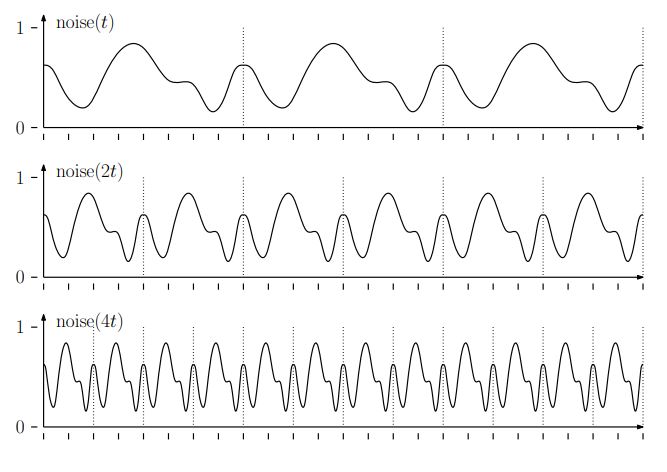
将不同周期的噪声按照某种权重进行混合,就构成了 Perlin Noise 。
通常将周期不断翻倍,同时将权重不断减半。这里有一种分型的概念。
2D Perlin Noise Generator
算法
Ken Perlin 在他的网站上公布了 Perlin Noise 改进版的实现4。
Perlin 噪声是一种基于网格的渐进式噪声函数,常用于生成自然感的纹理、地形等。二维版本的实现过程如下:
1. 网格划分
将二维空间划分成一个规则的整数格点网格,每个格点都关联一个随机梯度向量(通常是单位向量,方向均匀分布)。
2. 计算插值点的相对位置
给定采样点 $(x, y)$,先确定它所在的格点单元,即计算格点左下角的整数坐标 $(X, Y)$,
$$ X = \lfloor x \rfloor, \quad Y = \lfloor y \rfloor $$
计算采样点相对于左下格点的局部坐标,
$$ x_{rel} = x - X, \quad y_{rel} = y - Y $$
3. 计算格点梯度与距离向量的点积
对于这个单元的4个角(格点),
$$ (X, Y), (X+1, Y), (X, Y+1), (X+1, Y+1) $$
分别取出每个格点对应的梯度向量 $\vec{g}$,计算梯度向量与采样点到该格点的距离向量 $\vec{d}$ 的点积,
$$ \text{dot} = \vec{g} \cdot \vec{d} $$
4. 插值平滑
对上述4个点积结果,使用平滑插值函数(如 Ken Perlin 提出的 fade 函数)沿 x 和 y 方向进行双线性插值,
$$ u = \text{fade}(x_{rel}), \quad v = \text{fade}(y_{rel}) $$
5. 输出噪声值
插值后的结果就是采样点 $(x,y)$ 的噪声值,通常范围大约在 $[-1, 1]$。
Python Code
这里给出实现 2D Perlin Noise 算法的 Python 代码。
import numpy as np
import matplotlib.pyplot as plt
permutation = np.array([ 151,160,137,91,90,15,
131,13,201,95,96,53,194,233,7,225,140,36,103,30,69,142,8,99,37,240,21,10,23,
190, 6,148,247,120,234,75,0,26,197,62,94,252,219,203,117,35,11,32,57,177,33,
88,237,149,56,87,174,20,125,136,171,168, 68,175,74,165,71,134,139,48,27,166,
77,146,158,231,83,111,229,122,60,211,133,230,220,105,92,41,55,46,245,40,244,
102,143,54, 65,25,63,161, 1,216,80,73,209,76,132,187,208, 89,18,169,200,196,
135,130,116,188,159,86,164,100,109,198,173,186, 3,64,52,217,226,250,124,123,
5,202,38,147,118,126,255,82,85,212,207,206,59,227,47,16,58,17,182,189,28,42,
223,183,170,213,119,248,152, 2,44,154,163, 70,221,153,101,155,167, 43,172,9,
129,22,39,253, 19,98,108,110,79,113,224,232,178,185, 112,104,218,246,97,228,
251,34,242,193,238,210,144,12,191,179,162,241, 81,51,145,235,249,14,239,107,
49,192,214, 31,181,199,106,157,184, 84,204,176,115,121,50,45,127, 4,150,254,
138,236,205,93,222,114,67,29,24,72,243,141,128,195,78,66,215,61,156,180
], dtype=np.uint16)
p = np.tile(permutation, 2)
def grad(hash:int, x:float, y:float)->float:
grad_vectors = np.array([
[1, 1], [-1, 1], [1, -1], [-1, -1],
[1, 0], [-1, 0], [0, 1], [0, -1]
])
# 归一化梯度向量
grad_vectors = grad_vectors / np.linalg.norm(grad_vectors, axis=1)[:, None]
g = grad_vectors[hash % 8]
return np.dot(g, [x, y])
def lerp(t: float, a: float, b: float)->float:
return a + t * (b - a)
def fade(t: float)->float:
return t * t * t * (t * (t * 6 - 15) + 10)
def get_noise(x:float, y:float):
X = int(np.floor(x)) & 255
Y = int(np.floor(y)) & 255
x = x % 1
y = y % 1
u = fade(x)
v = fade(y)
## 这里其实只要保证hash唯一就可以了
x1 = p[p[X] + Y]
x2 = p[p[X+1] + Y]
x3 = p[p[X] + Y + 1]
x4 = p[p[X+1] + Y + 1]
## x3 x4
## x1 x2
## vector 方向都是从整数点 指向 噪声采样点
return lerp(v, lerp(u, grad(x1, x, y), grad(x2, x - 1, y)),
lerp(u, grad(x3, x, y - 1), grad(x4, x - 1, y - 1)))
def get_perlin_noise(width=256, height=256, scale=8.0, octaves=1, persistence=0.5, lacunarity=2.0):
noise_arr = np.zeros((height, width), dtype=np.float32)
for i in range(height):
for j in range(width):
for k in range(octaves):
x = (j / width) * scale * (lacunarity ** k)
y = (i / height) * scale * (lacunarity ** k)
noise_arr[i, j] += (persistence ** k) * get_noise(x, y)
return noise_arr
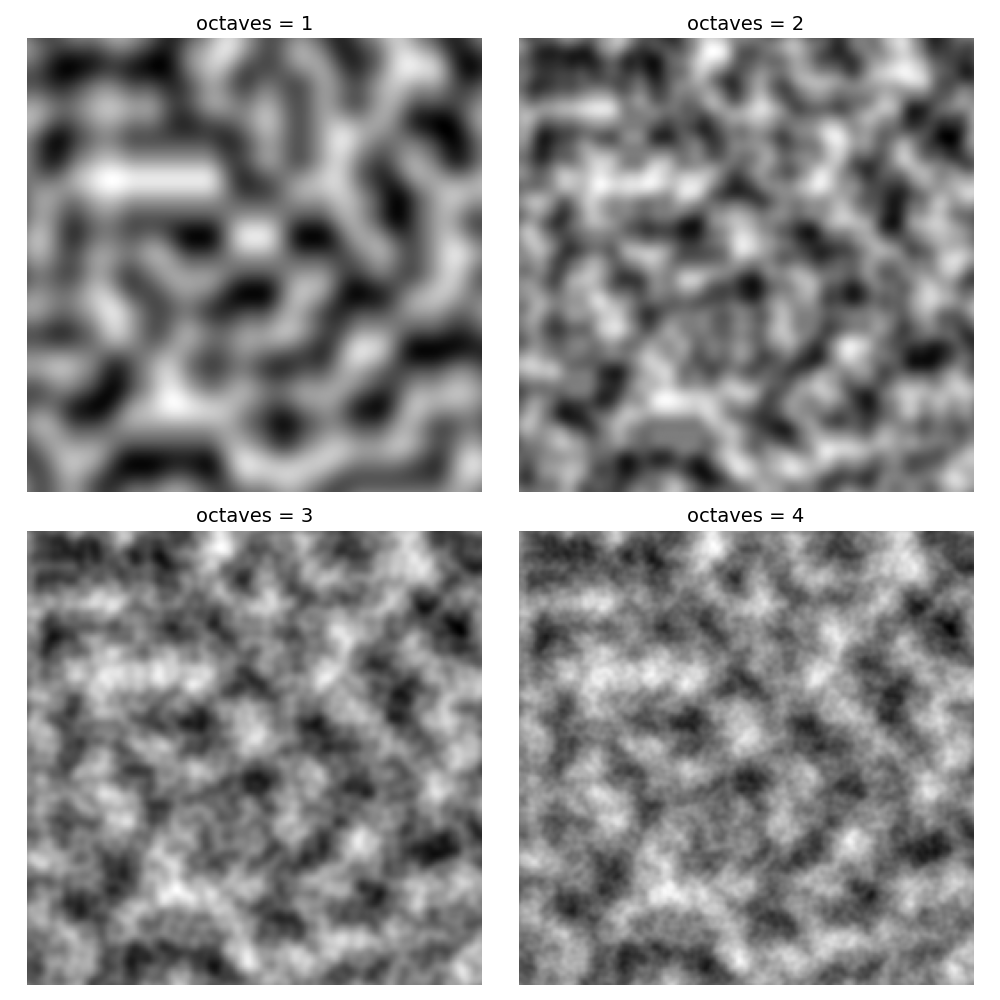
fig, axs = plt.subplots(2, 2, figsize=(10, 10))
for octave_count, ax in zip(range(1, 5), axs.flatten()):
noise_arr = get_perlin_noise(width=256, height=256, scale=8.0, octaves=octave_count)
# 可选将范围变为 0~1
noise_arr = (noise_arr - noise_arr.min()) / (noise_arr.max() - noise_arr.min())
ax.imshow(noise_arr, cmap='gray')
ax.set_title(f'octaves = {octave_count}', fontsize=14)
ax.axis('off')
plt.tight_layout()
plt.savefig('perlin_noise_octaves_1_to_4.png')
梯度值如何改进
使用固定梯度值而不是 Hash 完全均匀随机产生的梯度值,是避免导致方向性偏差,影响视觉自然度5。
在原版中,梯度值是均匀分布在球面上,但是立方体并不是球面均匀的,沿着坐标轴方向会缩短,沿着对角线方向会拉长。
这种方向上的不对称,容易导致一种零星的聚集效应:当一些彼此接近、方向几乎与坐标轴平行的梯度碰巧朝同一个方向排列时,就会在这些区域出现异常偏高的数值。
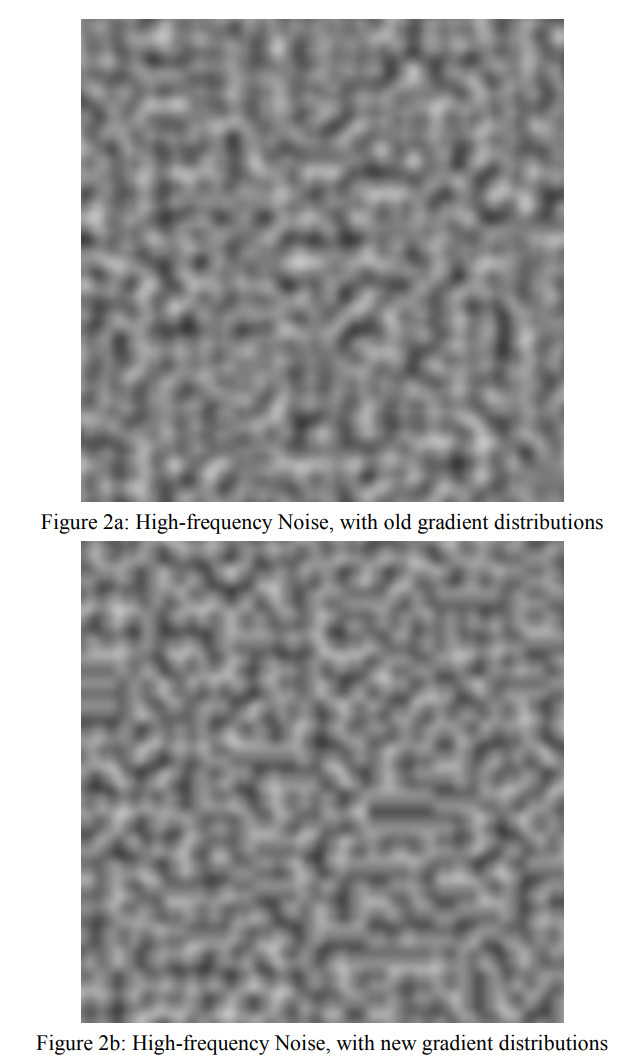
所以 Perlin 在改进论文中建议选择:
$$ (1,1,0),(-1,1,0),(1,-1,0),(-1,-1,0), (1,0,1),(-1,0,1),(1,0,-1),(-1,0,-1), (0,1,1),(0,-1,1),(0,1,-1),(0,-1,-1) $$
同时为了避免除以 12 的开销,他将梯度方向补齐到 16 个,额外添加了 $(1,1,0),(-1,1,0),(0,-1,1),(0,-1,-1)$。
本文参考了这个实现方式,使用的是平面8个方向的梯度,并且都进行了长度的归一化。
如果是一维的 Perlin Noise,可以不进行归一化来增加波动。一维的 Perlin Noise 可以视作在二维的 Perlin Noise 沿着晶格画一条线,此时不在线上的晶格的权重都是0,和一维的 Perlin Noise 没有区别。在这种情况下,梯度值在水平方向上的投影就不是唯一的1, 斜边的投影大小是 $ \frac{\sqrt{2}}{2} $。
Fade 函数的改进
Perlin5 在论文中提出的改进就是替换 Fade 函数为二阶平滑的函数,也就是我上面所用的函数。
原因是,如果二阶导数不是平滑的话,当它用于做表面替换的时候,能够看出非常明显的方块样式。
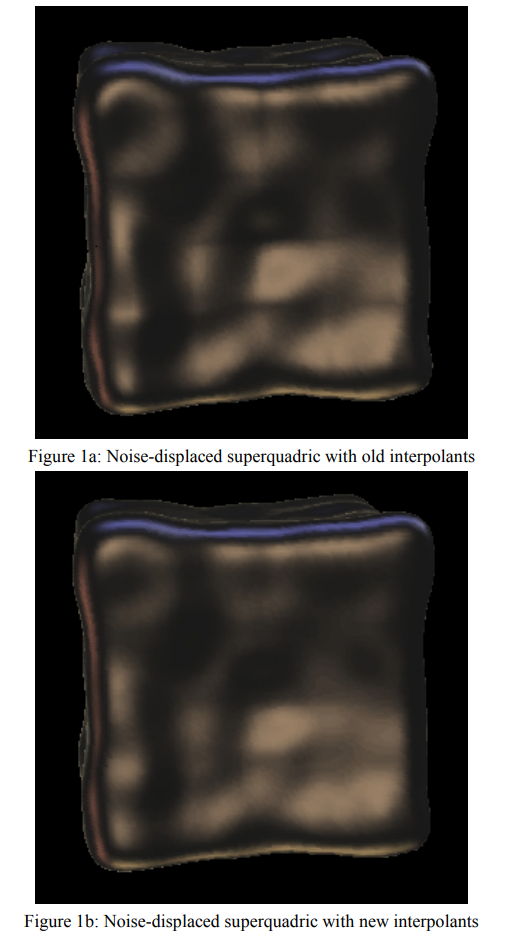
所以最好遵循以下原则:
- 在 0 和 1 的时候,导数应该为 0,使得其尽可能平滑过渡。甚至高阶导也可以为 0。
- $ f(0) = 0 $
- $ f(1) = 1 $
应用举例
Python Noise 库
实际使用过程中,我们完全不需要编写 Perlin Noise 的代码。而是使用 Python Noise 库就可以直接生成 Perlin Noise 。
import numpy as np
import matplotlib.pyplot as plt
from noise import pnoise2

width, height = 512, 512
scale = 64.0  # 控制噪声“拉伸”程度,数值越大变化越缓慢
octaves = 6
persistence = 0.5
lacunarity = 2.0

noise = np.zeros((height, width))
for y in range(height):
    for x in range(width):
        nx = x / scale
        ny = y / scale
        noise[y][x] = pnoise2(nx, ny, octaves=octaves, persistence=persistence, lacunarity=lacunarity, repeatx=1024, repeaty=1024, base=0)

# Perlin噪声默认范围大致在[-1,1],归一化到[0,1]
noise = (noise - noise.min()) / (noise.max() - noise.min())

plt.imshow(noise, cmap='gray')
plt.axis('off')
plt.imsave('perlin_noise_2d_lib.png', noise, cmap='gray')
plt.show()
由于进行了优化,它的生成速度非常快:
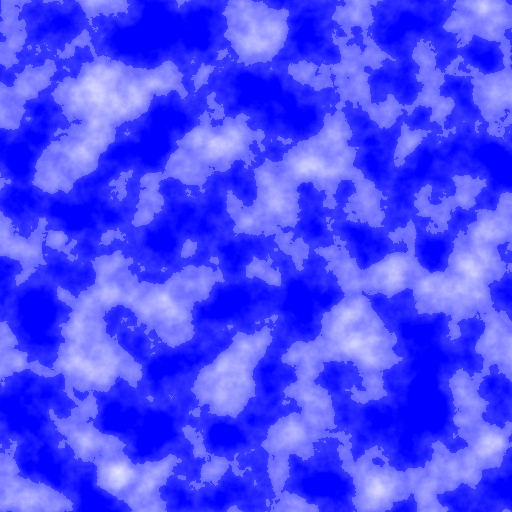
云层
用 Perlin Noise 模拟简单云层纹理。
模拟云层边缘的消散效果
模拟中心的高亮,因此大于阈值部分不动,只在某个范围内进行下列的操作。
$$ \text{Intensity} = max(\text{Intensity} - 40, 0) $$
import numpy as np
from PIL import Image

# 读灰度图,保持 0~255 整数
img = Image.open('perlin_noise_2d_lib.png').convert('L')
arr = np.array(img).astype(np.int32)  # 0~255

height, width = arr.shape

# 创建RGB图,纯蓝底 (R,G,B) = (0,0,255)
rgb_img = np.zeros((height, width, 3), dtype=np.uint8)
for y in range(height):
    for x in range(width):
        r, g, b = 0, 0, 255

        cloud_intensity = arr[y, x]  # 0~255

        cloud_intensity = cloud_intensity - 30

        if cloud_intensity < 100:
            cloud_intensity = max(cloud_intensity - 40, 0)

        # 线性混合,cloud_intensity 代表白云强度 (0~255)
        # 先计算权重:cloud_intensity / 255
        w = cloud_intensity / 255

        r = int(r * (1 - w) + w * 255)
        g = int(g * (1 - w) + w * 255)
        b = int(b * (1 - w) + w * 255)

        rgb_img[y, x, 0] = r
        rgb_img[y, x, 1] = g
        rgb_img[y, x, 2] = b

# 直接保存uint8数组
im = Image.fromarray(rgb_img)
im.save('perlin_cloud.png')
云层效果如图:
Unity Noise Editor
在 Unity 中安装 Terrain Tools 工具后,在 Window > Terrain > Edit Noise 中可以找到噪声生成器,它可以直接生成包含 Perlin Noise 在内的各种噪声,并导出为纹理。
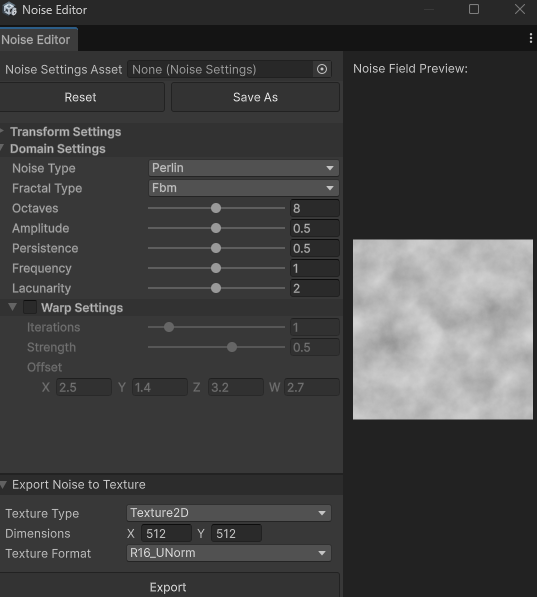
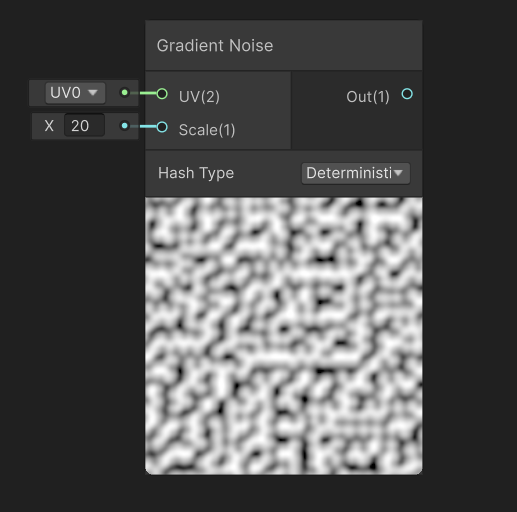
或者,也可以直接在Unity Shader Graph里面找到Gradient Noise。
Perlin, K. (1985). An image synthesizer. ACM Siggraph Computer Graphics, 19(3), 287-296. ↩︎
Perlin Noise wiki, https://en.wikipedia.org/wiki/Perlin_noise ↩︎
Roger Eastman. (2019). CMSC425.01 Spring 2019 Lecture 20: Perlin noise I. University of Maryland. https://www.cs.umd.edu/class/spring2019/cmsc425/handouts/CMSC425Day20.pdf ↩︎
Ken Perlin. (2022). Improved Noise reference implementation. https://mrl.cs.nyu.edu/~perlin/noise/ ↩︎
Perlin, K. (2002, July). Improving noise. In Proceedings of the 29th annual conference on Computer graphics and interactive techniques (pp. 681-682). ↩︎ ↩︎